
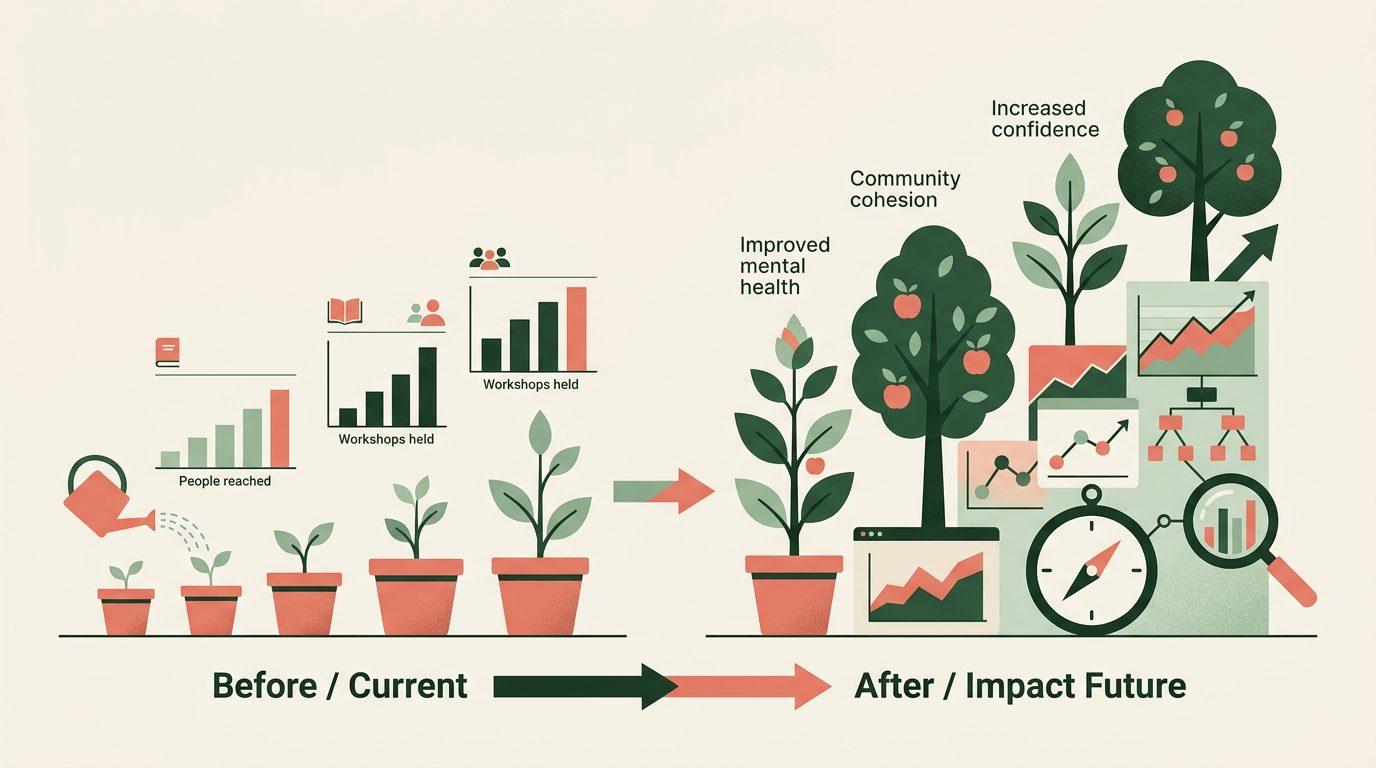
Introduction: Measuring Impact Made Simple for Small Charities
You're running a fantastic charity, providing vital services, and making a real difference in people's lives. But then comes the funding application, and suddenly you're faced with questions about 'impact measurement' and 'theories of change' that feel like they belong in a university research department. It can be daunting, especially when your team is small, resources are stretched, and every minute is dedicated to your beneficiaries.
The good news is that measuring your charity's impact doesn't require a dedicated research team or an unlimited budget. This article will guide you through a practical, funder-credible approach to impact measurement that focuses on what truly matters: demonstrating the positive changes you create. We'll demystify the jargon, provide actionable steps, and show you how to collect meaningful data that satisfies funders and helps you improve your services, all without needing to become a data scientist.
"Measuring impact isn't just for big charities. It's about telling your story with evidence, showing that your hard work translates into tangible good, and securing the funding you need to keep going."
Key Takeaways
- Start with a simple, focused theory of change.
- Don't try to measure everything; pick 2-3 key outcomes.
- Use a pre-validated tool for each outcome to ensure credibility.
- Collect 'before and after' data from every beneficiary.
- Focus on demonstrating tangible improvements in people's lives.
Demystifying Impact: Outputs vs. Outcomes
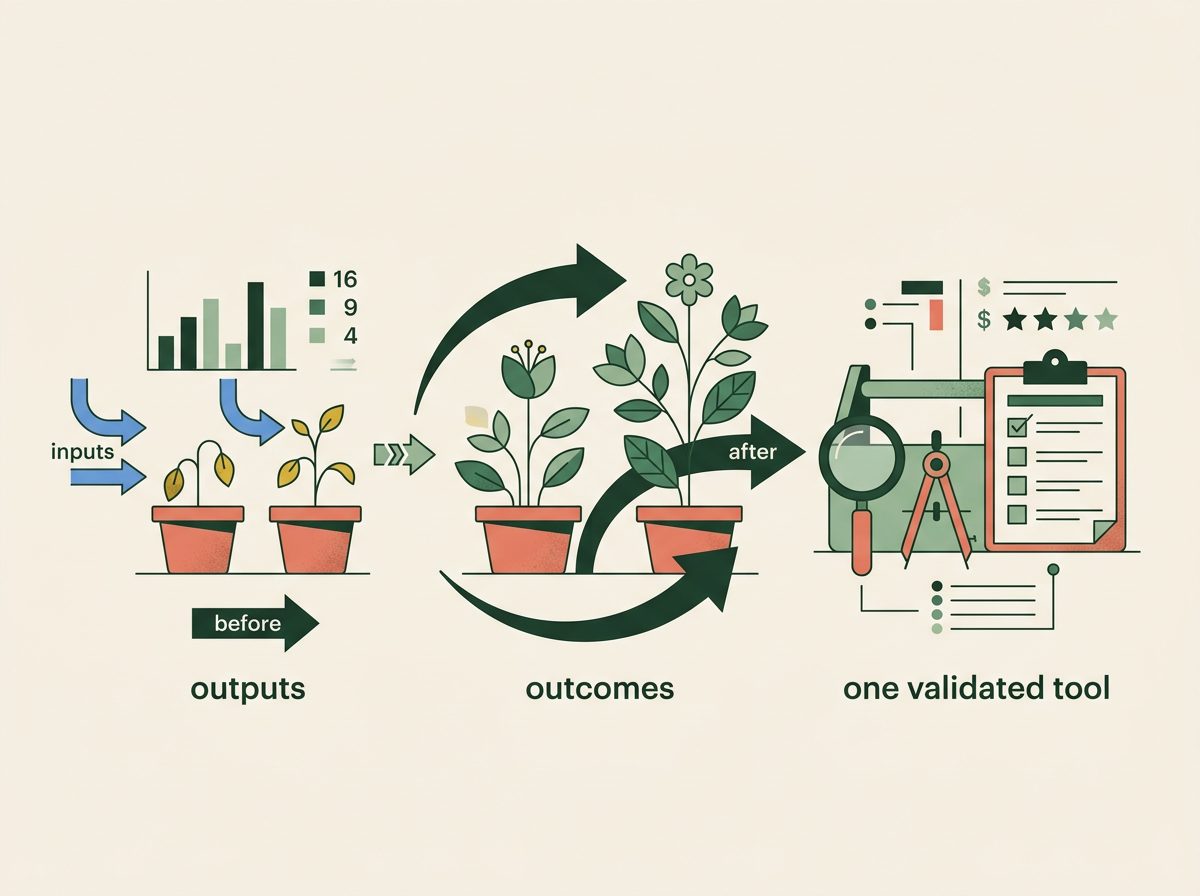
First, let's clear up some common confusion. Funders often talk about 'outputs' and 'outcomes,' and it's essential to understand the difference. Think of it like this:
- Outputs: What you do. These are the direct results of your activities, the things you can count. Examples include: number of workshops delivered, number of people attending your support groups, number of meals served, or hours of advice provided. They indicate activity levels but don't tell you if that activity led to any change.
- Outcomes: What changes as a result of what you do. These are the benefits or changes experienced by your beneficiaries. Examples include: improved mental wellbeing, increased confidence, better financial literacy, reduced social isolation, or enhanced living skills. Outcomes are the 'so what?' of your work – the meaningful impact.
Funders are primarily interested in your outcomes. While outputs show you're busy, outcomes prove you're effective. Our approach will focus squarely on demonstrating these crucial changes.
Step 1: Develop a Simple Theory of Change
A theory of change is simply your explanation of how and why your activities will lead to the outcomes you expect. It doesn't need to be a complex diagram; a few sentences or bullet points will often suffice. It helps you clarify your thinking and articulate your purpose.
Ask yourself:
- What is the problem we are trying to solve? (e.g., loneliness in older adults, lack of digital skills for job seekers).
- What activities do we deliver to address this problem? (e.g., weekly social clubs, free IT training courses).
- What short and medium-term changes do we expect to see in our beneficiaries because of these activities? (e.g., participants report feeling less lonely, job seekers gain confidence in using computers).
- What long-term impact do we hope to achieve? (e.g., improved quality of life for older adults, increased employment rates).
For example, a charity running a weekly art therapy group might have a theory of change like this: "We believe that providing a safe, creative space (activity) for individuals experiencing anxiety will help them express emotions and connect with others, leading to improved mental wellbeing and reduced feelings of isolation (outcomes). Ultimately, this contributes to a more resilient and connected community (long-term impact)."
Step 2: Select Just 2-3 Key Outcomes
This is crucial for small charities: don't try to measure everything. Trying to track a dozen different outcomes will overwhelm your team and dilute your data. Instead, focus on the 2-3 most important, direct changes your beneficiaries experience because of your core services.
Think about your theory of change. What are the absolute critical transformations you aim for? For a food bank, while providing food is an output, an outcome might be 'reduced food insecurity' or 'improved household budgeting skills' (if you offer wrap-around support). For a youth mentoring programme, 'increased self-esteem' or 'improved school engagement' might be key outcomes.
By narrowing your focus, you can collect more robust data on these specific outcomes, making your impact demonstrations much stronger and more credible to funders.
Step 3: Leverage Validated Measurement Tools
This is where many small charities can feel out of their depth. How do you objectively measure something like 'confidence' or 'wellbeing'? The answer is to use 'validated tools' or 'standardised scales'. These are questionnaires or surveys that researchers have already rigorously tested to ensure they accurately measure what they claim to measure.
Using a validated tool offers several significant advantages:
- Credibility: Funders trust these tools because they're scientifically robust.
- Comparability: You can compare your results with other organisations using the same tools.
- Simplicity: They are often quick and easy for beneficiaries to complete.
Here are some widely used, publicly available examples relevant to many UK charities:
| Outcome Area | Validated Tool/Scale | Notes |
|---|---|---|
| Mental Wellbeing | Warwick-Edinburgh Mental Wellbeing Scale (WEMWBS) | 14-item scale, widely used in the UK health and social care sectors. |
| Life Satisfaction | Satisfaction with Life Scale (SWLS) | 5-item scale, easy to use across diverse populations. |
| Self-Efficacy/Confidence | General Self-Efficacy Scale (GSE) | 10-item scale, measures belief in one's ability to succeed. |
| Social Isolation/Loneliness | UCLA Loneliness Scale (Version 3) | 20-item scale, well-established for measuring subjective feelings of loneliness. |
| Activation/Engagement | Patient Activation Measure (PAM) | Measures knowledge, skills, and confidence for managing one's health/care. (Often licensed, check usage terms). |
Search online for a tool relevant to your chosen outcomes. Many are freely available for non-commercial use, but always check their specific licensing terms. They usually come with scoring instructions.
Step 4: Collect 'Before and After' Data from Every Beneficiary
This is the cornerstone of robust impact measurement for small charities. To truly demonstrate change, you need to know where your beneficiaries started and where they ended up after engaging with your service. This is called a 'matched before-and-after' design.
The process is simple:
- On entry to your service: Ask each beneficiary to complete your chosen validated tool(s). This gives you their 'baseline' or 'before' score.
- On exit or at a defined point after intervention: Ask the same beneficiary to complete the same validated tool(s) again. This gives you their 'after' score.
- Match the data: Ensure you can link the 'before' score to the 'after' score for each individual (you'll need a unique, anonymised identifier for this, e.g., a participant ID rather than a name).
By comparing the 'before' and 'after' scores for each person, you can calculate the individual change. Then, you can aggregate these changes to show the overall impact across your beneficiary group. This provides compelling evidence of the difference your charity makes.
For example, if the average WEMWBS score for a group starts at 30 and increases to 40 after your intervention, that's a clear, quantifiable improvement in mental wellbeing. This data is powerful and funder-credible.
Analysing and Presenting Your Impact
Once you have your 'before' and 'after' data, what do you do with it? Even without statistical expertise, you can perform basic, impactful analysis:
- Calculate average change: Find the difference between the 'before' and 'after' scores for each beneficiary, then calculate the average change across all participants.
- Percentage of beneficiaries showing improvement: Calculate how many individuals showed a positive change in their scores.
- Quotes and stories: While quantitative data is vital, qualitative stories bring your impact to life. Collect anonymised quotes from beneficiaries about how your service has helped them, linking them back to your outcomes where possible.
When presenting to funders, combine these elements. Start with your theory of change, present your 2-3 key outcomes, show your 'before and after' data (e.g., "Our beneficiaries' average wellbeing scores increased by X points, and Y% reported feeling more confident"), and then illustrate this with powerful quotes and case studies.
Next Steps
Embracing this practical approach to impact measurement can transform how your charity demonstrates its value. It's about working smarter, not harder, and focusing on the evidence that truly matters to those who fund your vital work. Start small, be consistent, and watch your ability to articulate your impact grow, helping you secure the resources needed to continue your mission.